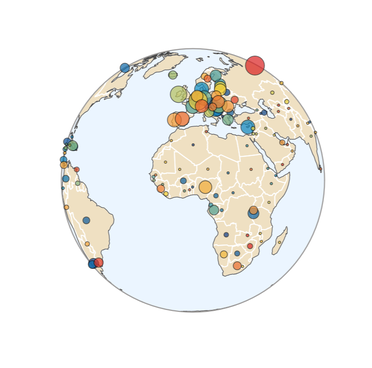
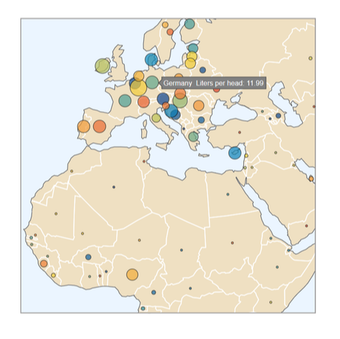
An interactive visualization of the average alcohol consumption across the world
|
|
BackEnd: Python web server (built with bottle framework), combination of API calls to retrieve data values and coordinates.
FrontEnd: JavaScript, using Plotly library, to process and visualize the returned data and specify the map's responsiveness.
FrontEnd: JavaScript, using Plotly library, to process and visualize the returned data and specify the map's responsiveness.
| |||
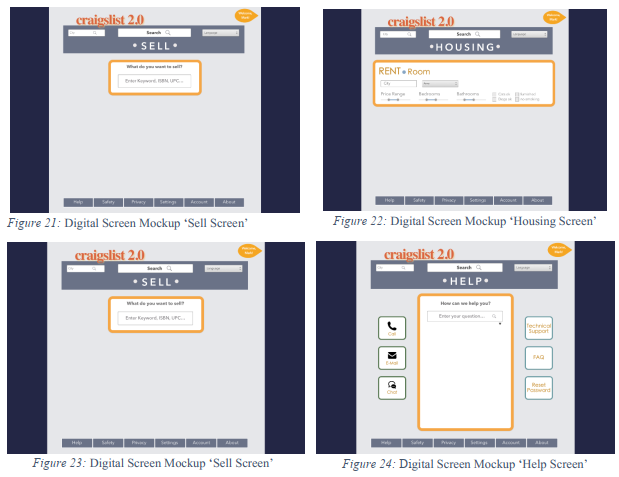
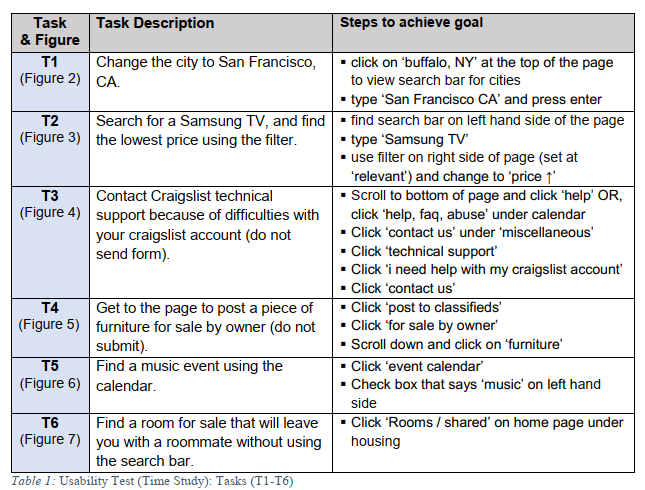
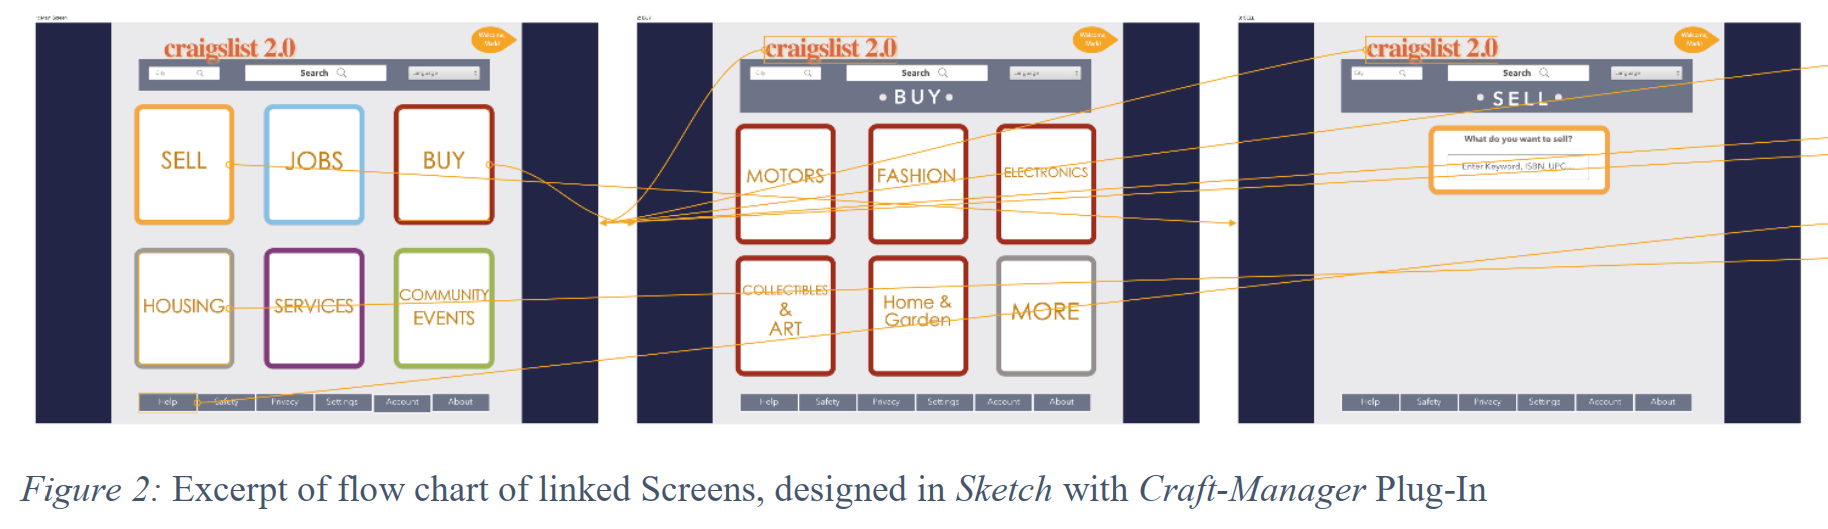
Website Remake of Craigslist
Interaction Design Process
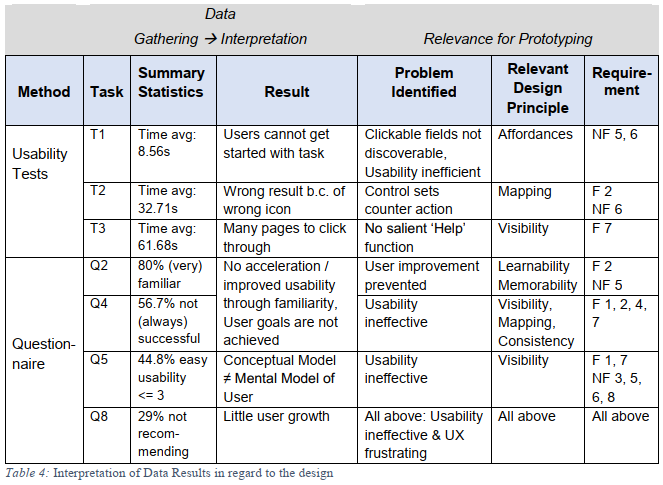
In the scope of Human Computer Interaction at the Department of Industrial & Systems Engineering, UB, we have conceptualized and designed a new UI in a user-centered process for the classified advertisements website Craigslist.
Besides focusing on Usability Goals (Effectiveness, Efficiency, Memorability etc.) and UX Goals (Aesthetics, Look/Feel, Content etc.), we tried to meet HCI Design Principles neglected in the former UI such as Visibility, Feedback, Mapping and Consistency.
Besides focusing on Usability Goals (Effectiveness, Efficiency, Memorability etc.) and UX Goals (Aesthetics, Look/Feel, Content etc.), we tried to meet HCI Design Principles neglected in the former UI such as Visibility, Feedback, Mapping and Consistency.
The process involved UX methods including
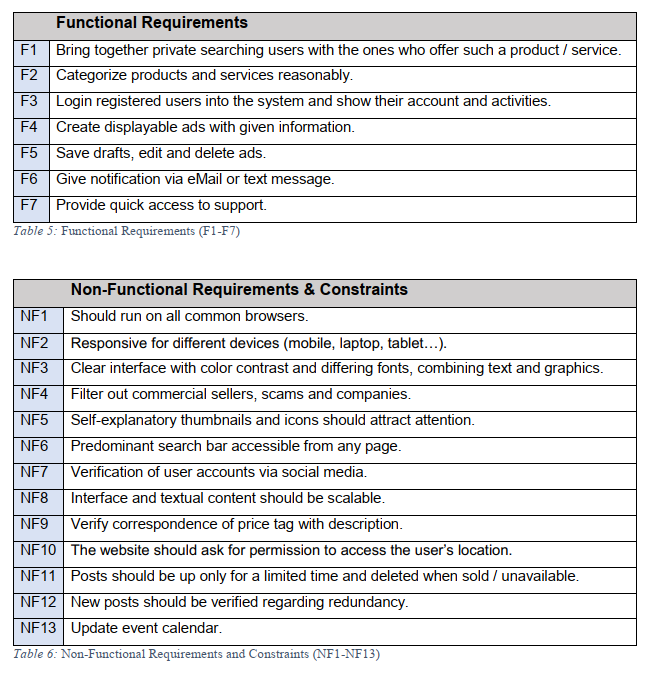
- Requirement Gathering
- Development of Personas and Use Cases
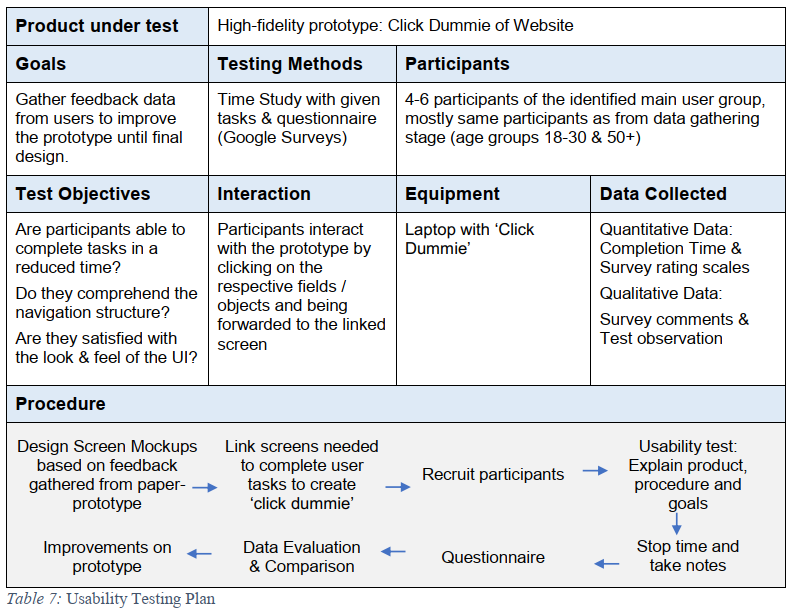
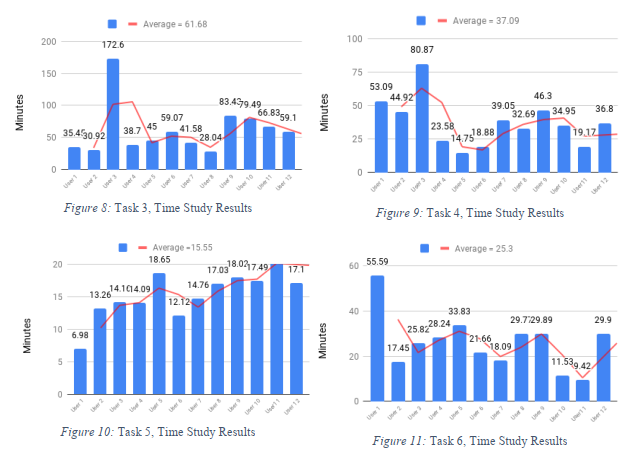
- Usability Testing, Questionnaires,
- (Qualitative and Quantitative) Data Interpretation
- Prototyping: Low-fidelity wireframe, mockup and high-fidelity Click-dummy
- Documentation on the entire process and results.
The project was realized in a 5-person team effort with me taking responsibility primarily for the Data Interpretation, UI Design and Documentation.
Generative Art